



Data Analysis Training in Akure, Ondo State: A Complete Guide
Data is becoming one of the most valuable resources for modern businesses and organisations. Companies collect information from customers, transactions, websites, social media, operations and other sources, but raw data only becomes useful when it can be properly understood and converted into meaningful insights.
This is where data analysis comes in. Data analysts help organisations examine information, identify patterns, measure performance, answer important questions and support better decisions.
If you are searching for data analysis training in Akure, Ondo State, this guide explains what you need to learn, the tools commonly used by analysts, the type of practical experience you should look for and how a structured training programme can help you develop job-relevant skills.
VOKS Institute provides a structured Data Analysis programme designed around practical analytical skills, including Microsoft Excel, SQL, Python and Power BI. The programme is available through physical training in Akure and live virtual learning for students who prefer remote participation.




What Is Data Analysis?
Data analysis is the process of examining data to discover useful information, identify patterns, answer questions and support decision-making.
In practical terms, a data analyst may receive a large and disorganised dataset and need to determine what the information means. The analyst may clean the data, organise it, perform calculations, identify trends, create visualisations and communicate the findings to other people in the organisation.
The process can therefore involve several connected activities, including:
Collecting or accessing relevant data
Understanding the structure and quality of the data
Cleaning and preparing the dataset
Analysing the information
Identifying patterns and trends
Creating charts, reports and dashboards
Communicating useful insights
Why Learn Data Analysis in Akure?
Learning data analysis can be valuable for people who want to build technology skills, improve their professional capabilities or move into a data related career.
Data is used across many industries, including banking, finance, healthcare, education, marketing, logistics, telecommunications, retail, government and technology.
This means that learning data analysis is not limited to people who want to work for technology companies. Professionals in other industries can also benefit from learning how to work with data.
Who Should Learn Data Analysis?
A data analysis course can be suitable for people from different educational and professional backgrounds. You do not necessarily need to be an experienced programmer before starting.
Data analysis training can be useful for:
University students
Graduates
NYSC members
Working professionals
Business owners
Entrepreneurs
Administrative professionals
Career changers
Beginners interested in technology
Professionals who work regularly with business information
What Should You Learn in a Data Analysis Course?
A good data analysis programme should not simply teach you how to click through different software menus. You should understand how the tools fit into the larger data analysis process.
At VOKS Institute, the Data Analysis curriculum covers several important areas, including Excel, SQL, Python and Power BI.
1. Microsoft Excel for Data Analysis
Excel remains an important tool for working with structured data. A learner should understand how to organise datasets, clean information, perform calculations, analyse records and communicate results using charts and dashboards.
The VOKS Institute curriculum includes areas such as data cleaning, sorting and filtering, data types, text functions, date data, lookup functions, pivot tables, aggregation functions, logical functions and data visualisation.
Students also work with Excel charts and dashboards so that they can move beyond simple spreadsheets and communicate analytical findings more effectively.
2. SQL and Database Analysis
SQL is an important skill for analysts who need to retrieve and analyse information stored in relational databases.
Training in SQL should cover the fundamentals of databases and gradually introduce learners to queries, filtering, sorting, aggregation and joining information from different tables.
The VOKS Institute Data Analysis curriculum uses MySQL and includes SQL concepts such as SELECT, WHERE, ORDER BY, GROUP BY, HAVING, aggregate functions, operators, aliases, wildcards and different types of joins.
3. Python for Data Analysis
Python can be used to automate analytical tasks, manipulate datasets and perform more advanced data analysis workflows.
A beginner-focused data analysis programme should introduce Python gradually rather than assuming that learners already know how to program.
The VOKS Institute curriculum introduces Python syntax, variables, data types, conditional statements and Jupyter-based development before progressing into analytical libraries such as NumPy and Pandas.
Students also encounter Matplotlib and Seaborn for data visualisation.
4. Power BI for Data Visualisation
Data analysis is not complete when you have calculated an answer. You also need to communicate your findings in a way that other people can understand.
Power BI can be used to transform data into interactive reports and dashboards.
The VOKS Institute curriculum introduces learners to the Power BI environment, data loading, Power Query, data transformation, visualisation, dashboards, reports, slicers, tables, KPIs, maps and data modelling.
How the Data Analysis Process Works
Learning individual tools is important, but an effective analyst must also understand how those tools work together.
-
Understand the Problem: Start by identifying the question you need the data to answer.
-
Collect or Access the Data: Obtain the relevant information from the appropriate source.
-
Clean the Data: Identify missing, duplicated, inconsistent or incorrectly formatted information.
-
Explore the Data: Examine the dataset to understand its structure, relationships and patterns.
-
Analyse the Data: Apply appropriate calculations, queries or analytical methods.
-
Visualise the Findings: Present important results through appropriate charts, reports or dashboards.
-
Communicate the Insight: Explain what the results mean and why they matter.
Why Practical Projects Matter in Data Analysis Training
One of the biggest differences between simply watching data analysis tutorials and actually becoming comfortable with data is practice.
A learner may understand what a pivot table, SQL JOIN or Power BI dashboard is, but that does not automatically mean the learner can use those tools to solve a real problem.
Practical projects allow students to work through the complete analytical process.
A typical project may require you to:
Understand a business question
Inspect a dataset
Identify data-quality issues
Clean and organise the information
Perform calculations or queries
Identify trends
Create visualisations
Build a dashboard
Present conclusions from the analysis
What Makes a Good Data Analysis Training Programme?
If you are comparing data analysis training options in Akure, do not choose a programme based only on the course title or certificate.
Instead, examine what you will actually learn and how much practical experience the programme provides.
Important factors include:
A clearly structured curriculum
Experienced instructors
Practical exercises
Realistic datasets and projects
Industry relevant tools
Instructor support
Regular assessments
Opportunities to build a portfolio
Physical or virtual learning options
A clear path towards professional development
Data Analysis Training at VOKS Institute
VOKS Institute provides a structured Data Analysis training programme for learners who want to develop practical skills for working with data.
According to the current course curriculum, the programme covers Microsoft Excel, SQL/MySQL, Python and Power BI, alongside data preparation, analysis, visualisation and data modelling.
The programme is structured as a 12 week course and is available through physical and live virtual learning options.
The training also includes assessments and a capstone project designed around the tools covered during the programme.
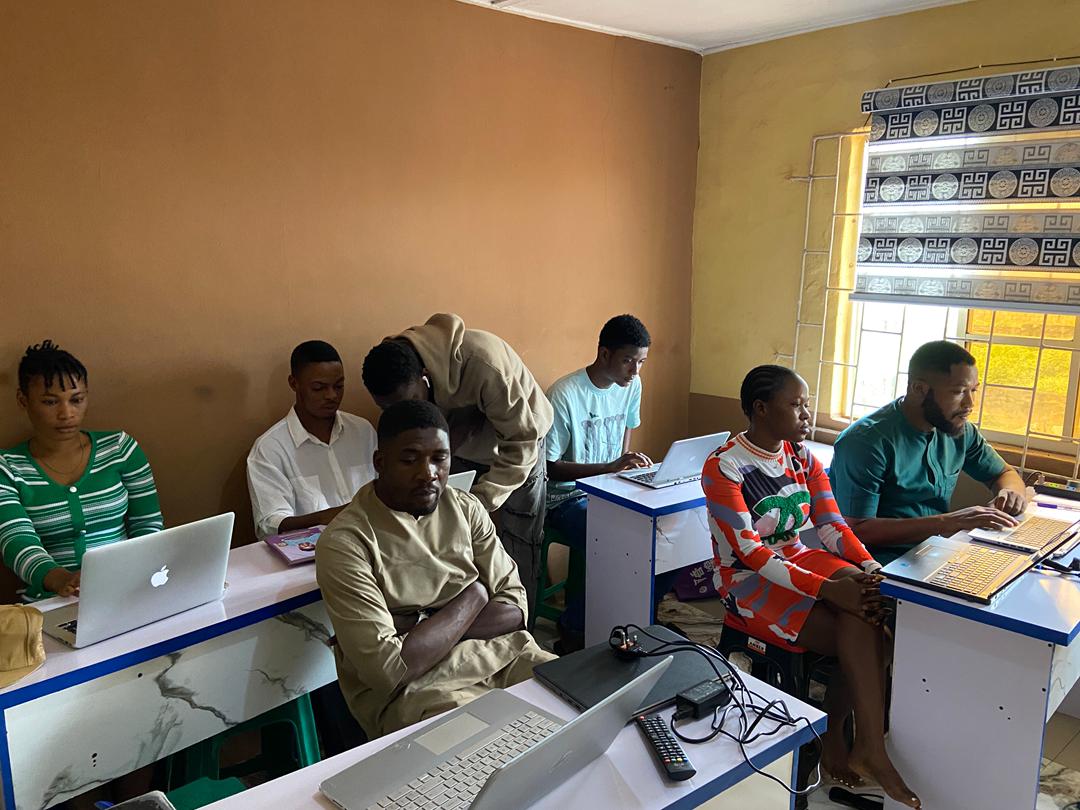
Image 1.0 Practical learning environment at VOKS Institute
What You Can Expect to Learn During the 12 Week Programme
The current VOKS Institute programme is structured progressively so that learners encounter the different areas of data analysis over the course of the training.
-
Weeks 1–2: Introduction to Data Analytics
-
Weeks 2–3: Data Analytics with Excel
-
Weeks 4–5: Data Analytics with SQL
-
Weeks 6–8: Data Analytics with Power BI
-
Weeks 9–10: Python for Data Analysis
-
Weeks 11–12: Full Capstone Project using Excel, SQL, Power BI and Python
Physical Data Analysis Training in Akure
Learners who prefer face-to-face instruction can attend the physical training option in Akure.
Physical learning can be particularly useful for beginners who prefer direct interaction with instructors, guided exercises and a structured classroom environment.
It can also make it easier to ask questions and receive immediate clarification when working through unfamiliar concepts.
Virtual Data Analysis Training for Learners Outside Akure
Learning data analysis does not necessarily require you to live in Akure.
VOKS Institute also provides live virtual learning for students who cannot attend the physical training location. This allows learners in other parts of Ondo State and Nigeria to participate remotely.
Virtual training can be particularly convenient for working professionals, students and people who live outside Akure.
How Long Does It Take to Learn Data Analysis?
There is no single amount of time that applies to everyone. The time required depends on your starting point, learning schedule, practice habits and the depth of the skills you want to develop.
A structured programme can make the process easier because you do not have to spend all your time deciding what to learn next.
The VOKS Institute Data Analysis programme is currently structured as a 12-week training programme, giving learners a defined path through the major tools and practical stages of data analysis.
What Career Paths Can Data Analysis Skills Support?
Data analysis skills can support different professional paths depending on your experience, additional skills and career goals.
Roles associated with the VOKS Institute programme include:
Data Analyst
Business Intelligence Analyst
Business Analyst
Financial Analyst
Risk Analyst
Data Engineer
Data Visualization Engineer
Data Governance Analyst
Your actual career opportunities will depend on your practical ability, portfolio, experience, education and the specific requirements of employers.
How to Start Learning Data Analysis in Akure
If you are starting from zero, avoid trying to learn every data tool simultaneously.
A more practical approach is to follow a structured progression:
Understand the fundamentals of data analysis.
Learn how to work with structured datasets.
Build spreadsheet analysis skills with Excel.
Learn SQL and understand relational databases.
Learn Python for data manipulation and analysis.
Learn Power BI and dashboard development.
Complete practical projects.
Build a portfolio demonstrating your analytical skills.
Continue improving your analytical and communication skills.
Frequently Asked Questions About Data Analysis Training
01. Can a complete beginner learn data analysis?
Yes. Beginners can learn data analysis by starting with the fundamentals and gradually developing their skills with tools such as Excel, SQL, Python and Power BI.
02. Do I need programming experience before learning data analysis?
Not necessarily. Many data analysis learning paths begin with spreadsheet-based analysis before introducing SQL and programming tools such as Python.
03. What tools should I learn for data analysis?
The tools you learn should depend on your goals and the type of work you want to perform. Excel, SQL, Python and Power BI are among the tools covered in the VOKS Institute Data Analysis programme.
04. Is data analysis different from data science?
Data analysis and data science overlap, but they are not identical. Data analysis generally focuses on examining data to answer questions and generate insights, while data science can involve broader areas such as statistical modelling, machine learning and predictive systems.
05. Can I learn data analysis online?
Yes. Live virtual training can allow learners to participate remotely without attending a physical classroom.
06. Can I learn data analysis physically in Akure?
Yes. VOKS Institute offers physical Data Analysis training in Akure for learners who prefer classroom-based instruction.
07. How long is the VOKS Institute Data Analysis training?
The current programme is structured as a 12-week Data Analysis training programme.
08. Will I work on practical projects?
The programme includes practical learning and a capstone project covering the major tools taught during the training.
Start Your Data Analysis Journey in Akure
Learning data analysis is not simply about collecting certificates or memorising software features. The real objective is to develop the ability to work with data, solve problems, identify useful information and communicate your findings clearly.
If you are based in Akure, Ondo State and want a structured path into data analysis, VOKS Institute provides a programme covering Excel, SQL, Python and Power BI alongside practical analytical work.
The programme is available through physical training in Akure and live virtual learning for people who prefer remote participation.
Before enrolling, review the current curriculum, duration, fees, learning options and course requirements so you can determine whether the programme matches your goals.
Conclusion
Data analysis is a practical skill that can help professionals and organisations make better use of information. However, becoming competent requires more than knowing the definition of data analysis. You need to understand data preparation, analysis, visualisation and communication while developing confidence with relevant tools.
For beginners in Akure and other parts of Nigeria, a structured training programme can provide a clearer path through the learning process. Starting with fundamentals and progressing through Excel, SQL, Python and Power BI can help you develop a broader understanding of the data analysis workflow.
If your goal is to build practical data analysis skills, choose a programme that gives you opportunities to practise, work with datasets, complete projects and understand how analytical tools are applied to real problems.
Related Data Analysis Resources
Continue exploring our Data Analysis learning resources, practical guides and course information: